Using crowdsourced flight tracking data, we quantified Covid-19’s unprecedented disruption to air travel. In Part 1 we showed how we did it using the OpenSky Network dataset, and now in Part 2 we show what we found.
 by Tomas Williams
We looked at flights in and out of the following 12 airports worldwide, for which good data was available - and from 17th November 2019, when the first case of coronavirus was recorded, until late September 2020.
| Europe |
USA |
East Asia |
Mid East/South Asia |
| London (LHR) |
New York (KJFK) |
Singapore (WSSS) |
New Delhi (VIDP) |
| Paris (LFPG) |
Los Angeles (KLAX) |
Seoul (RKSI) |
Dubai (OMDB) |
| Rome (LIRF) |
Dallas (KDFW) |
Hong Kong (VHHH) |
|
| |
|
Tokyo (RJTT) |
|
Unfortunately airports in mainland China didn’t have enough data, and for Tokyo we used Haneda as Narita had patchy data.
Changes in the number of flights
We tracked the number of daily flights (arrivals and departures) at each of our airports.
Air traffic late 2019 through 2020
As expected we see significant drops between March and April, corresponding to national lockdowns, followed by a recovery in flight numbers.
The re-opening recovery period is quite varied amongst airports and regions. US airports had a sharp bounce back in flights numbers in July, while in Asia most airports appear to have followed a very smooth and gradual re-opening. Europe sits in between. Paris had the sharpest recovery in Europe, but it looks to be reversing as a second wave emerges. On a casual look the sharpness of the airport recovery curve correlated strongly to infection rates in that region.
The Top Air Corridors for Different Airports before and during the Pandemic
We wondered if the flights still running were arriving from and going to the same places as pre-pandemic. So we extracted the top 3 most popular country routes for each airport on a monthly basis, and calculated a popularity score, which is charted below. There are columns for November 2019, April and September 2020. These are a snapshot of pre-pandemic, lockdown and re-opening.
most popular countries by airport and month
Much of the data is as expected, and the picture was similar to the months we didn’t show. In Europe there were small fluctuations between the different months and most flights were to surrounding European countries or to the US. There’s not many surprises with Dubai and New Delhi either.
With the United States and East Asia, we were confused to see Alaska (AK) making an appearance multiple times on both charts. We dug around and found that over the course of the pandemic, with passenger traffic down by over 90% at the worst points and cargo demand on the rise, Alaska’s Anchorage International Airport became a hub for the international transport of critical medical goods. With the geographical advantage of being at most a 9.5hr flight from 90% of the industrialised world, Anchorage rose from being to the fifth busiest cargo airport to claiming top spot.
Another quirk in the data was Bermuda becoming the second most popular airport for Texas. We went back to digging for a reason, however we didn’t unearth any clear answer. Perhaps with a large drop in prices, Texans jumped on the opportunity to go to a popular holiday at such a low price.
The Ratio of Domestic to International Flights
Lastly we wanted to see whether the drops in air traffic were from reducing international or domestic flights (or both).
ratio of domestic flights to international (higher means more domestic)
Italy was first in Europe to be hit by Coronavirus and it was hit hard. This is reflected in the large spike in Rome’s domestic:international flight ratio over the March-July period. At its peak, this ratio jumped four-fold on its pre-March trend levels (i.e. many more domestic flights relative to international). The sharp rise could be attributed to other countries placing travel restrictions on flights to and from Italy. There were also smaller jumps for London and Paris in the second half of March, coinciding with national lockdowns in those countries.
In the US we see jumps in the ratio of domestic flights for Los Angeles and New York, followed by a trough. We wonder if the trough is due to the subsequent cancellation of domestic flights, perhaps combined with a jump in cargo and repatriation flights. Interestingly Dallas appears to have remained largely unchanged in its ratio throughout.
For East Asia we excluded Tokyo because Haneda isn’t Tokyo’s main aiport and its ratio is very skewed to deomestic flights. Narita, traditionally Tokyo’s main international airport, had patchy data. Singapore’s airport also had somewhat patchy data to discern domestic vs international flights. Hong Kong’s ratio appears less affected than Seoul. It appears as if Seoul reduced international air traffic from mid-Feb and it has not yet returned to a more normal state.
Looking at Dubai, though not clearly visible due to the scaling with New Delhi, there was a huge spike (visible as a bump) towards the end of March, as Europe and Asia stopped allowing commercial international flights. This resulted in a short drastic reduction in international flights in an out of Dubai, which is a transit hub. For New Delhi we see a familiar spike as international flights were cancelled. The trough after from April to mid-May we suspect is a combination of cancelling domestic flights (with the nation under lockdown), starting repatriation flights and perhaps more cargo flights.
The large changes in the balance of domestic versus international travel we’ve observed, along with being driven by policy, could also be driven by a lack of consumer demand. Who wants to go on holiday abroad when you have to quarantine for two weeks at the other end?
Summary
It comes as no surpise that the pandemic has hugely disrupted air traffic worldwide. What’s been interesting are the similarities and differences in the approaches cities adopted. Following the initial shutdown to air travel, which was worldwide and almost simultaneous (over weeks), cities have been returning to normal at different paces. From cavalier Dallas through to cautious Seoul.
And for a brief time Alaska had one of the world’s busiest airports.
Rahman and Sachin - team@synced.to
Explore more on the Synced app, where you can find meaningful places, nearaway and faraway.
]]> artwork by Imagen 3
 artwork by
  artwork by
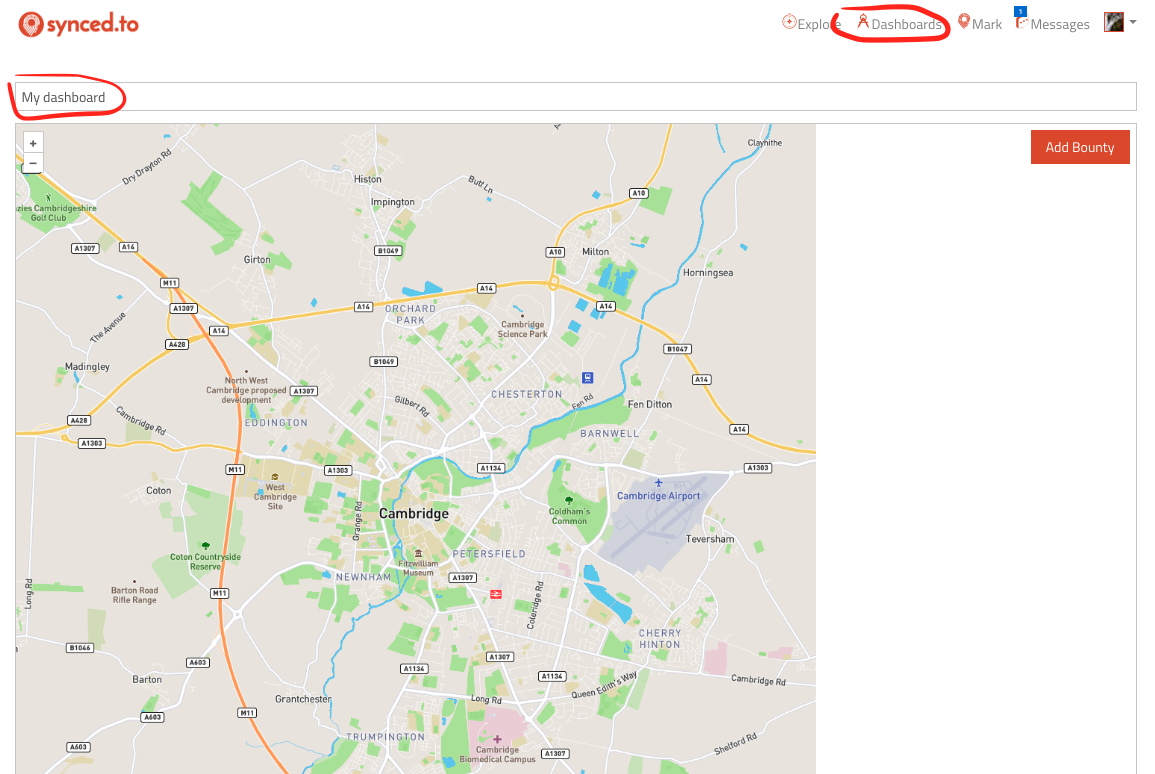
 artwork by
  artwork by


 by
by  by
by  Basic graphic of ADS-B by the
  Software Defined Radio Receiver (SDR) USB stick with banana for scale
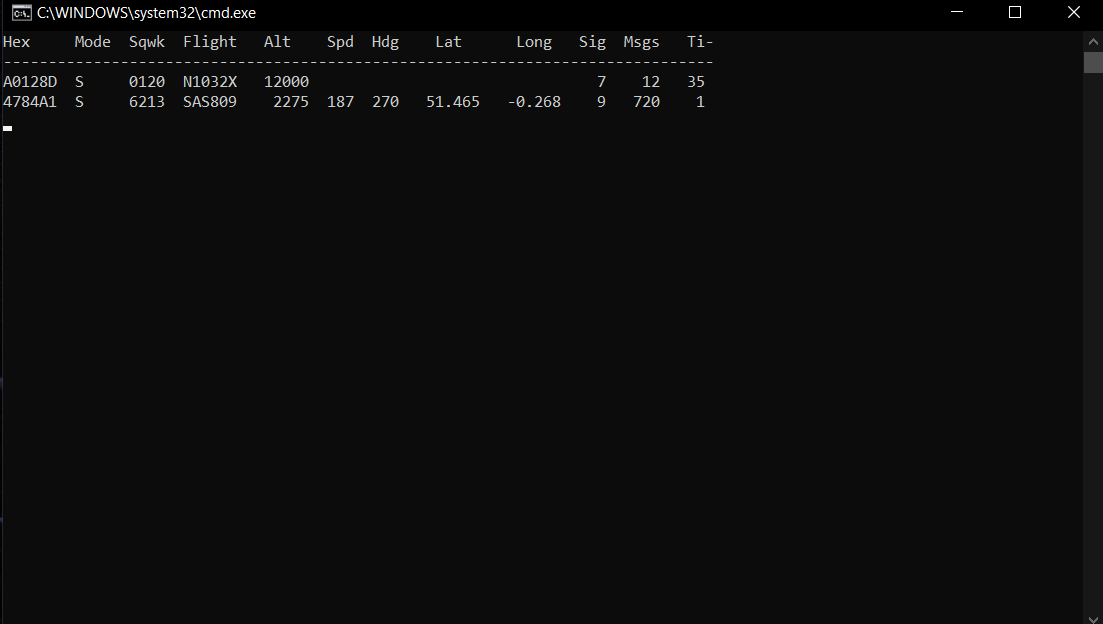 raw terminal output of Dump1090
 GUI output of Dump1090